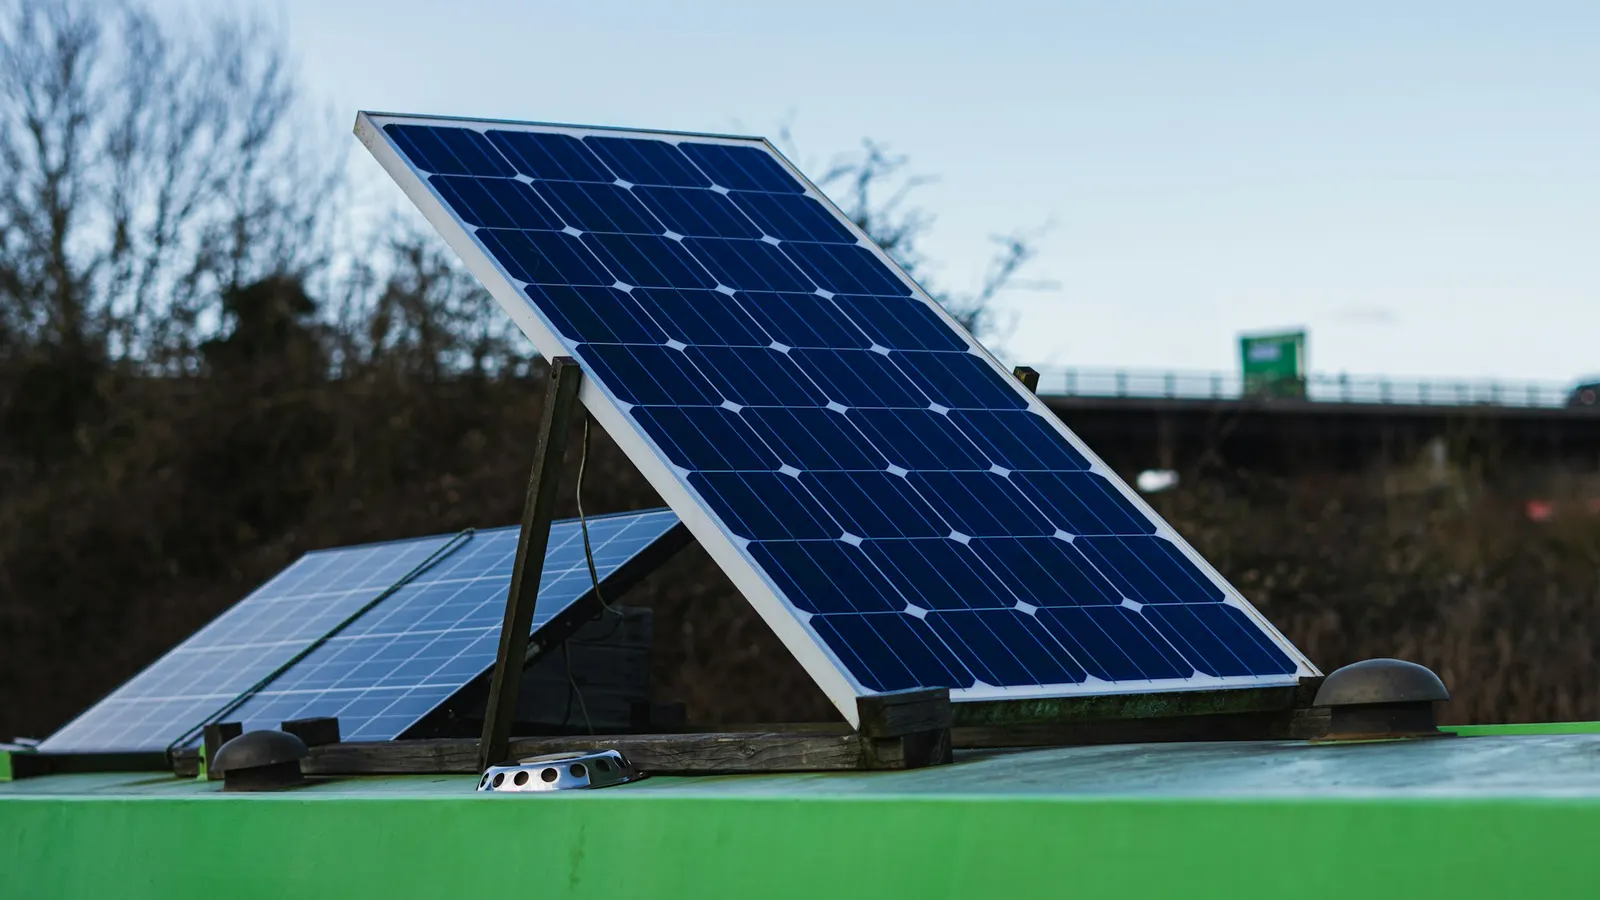
US, EU, and Chinese solar and wind capacity additions are hitting records in 2026 as AI-driven electricity demand offsets the loss of federal tax credits.
Renewable Energy Investment Hits Record Highs in 2026
Direct answer: 2026 is shaping up to be the biggest year on record for renewable energy investment and capacity additions worldwide, even though the United States rolled back federal wind and solar tax credits. The US is on pace for roughly $180 billion in clean energy investment and a record 45 GW of new capacity, China added nearly 500 GW of renewable capacity in 2025 alone, and the EU added a record ~85 GW in 2025 — with electricity demand from AI data centers cited as a major reason investment kept climbing even as subsidies shrank. The story isn't that policy support stopped mattering; it's that raw electricity demand growth, much of it tied to AI infrastructure, is now large enough to pull renewable investment forward on its own.
For anyone tracking energy markets, corporate sustainability commitments, or the infrastructure side of the AI boom, this is one of the more counterintuitive developments of the year: the policy tailwind disappeared, and the numbers went up anyway. That tension — record deployment against a backdrop of real, well-documented policy headwinds — is what makes 2026 worth understanding in detail rather than treating it as a simple "renewables are winning" headline.
What's Actually Happening
The clearest way to describe the current moment is that two forces are running in opposite directions at the same time, and one of them is currently winning by a wide margin.
On one side, the United States rolled back tax credits that had underpinned a decade of wind and solar investment planning. Developers who had built financial models around those credits suddenly had to recalculate project economics, and the reporting on this is unambiguous: E&E News and POLITICO have both covered how the phase-out reshaped the investment landscape heading into 2026. On the other side, the same reporting shows that renewable investment isn't just holding steady through that headwind — it's setting records. According to reporting cited by E&E News and POLITICO, renewable investments are on track to hit record levels in 2026 "despite" the credit cuts, not because of some unrelated tailwind that happens to coincide with them.
The scale of the numbers matters here. US clean energy investment for 2026 is projected at $180 billion, with $74 billion of capital expenditure already deployed in the first half of the year alone. That is not a modest figure — it implies a full second half of the year at a similar or greater pace just to hit the full-year projection, and it comes in a year when the primary federal subsidy structure that shaped the last several years of renewable planning was actively being dismantled.
Capacity additions tell the same story from a different angle. The US added a record 45 GW of new wind and solar capacity, which MarketScale's reporting describes as roughly 25% above the prior peak set in 2024. That's not a plateau after a rollback — it's an acceleration through one. And it wasn't a matter of legacy projects simply finishing construction on old timelines, either: IEA's Global Energy Review 2026 data on solar PV and wind, combined with US generation figures, shows wind and solar supplied 20% of US electricity generation in the first half of 2026, outpacing both coal and nuclear generation over the same period. Renewables didn't just get built — they got built and then they generated enough power to overtake two of the country's traditional baseload sources.
Globally, the picture is even larger. China added nearly 500 GW of renewable capacity in 2025, a figure so large it accounted for more than 60% of all new renewable capacity added anywhere in the world that year. The EU, for its part, set its own record with roughly 85 GW of new renewable capacity in 2025 — about 10% above what it added in 2024 — with solar PV responsible for roughly 70 GW of that EU total. Three of the world's largest economic blocs — the US, China, and the EU — all set renewable capacity records in the same rough window, and they did it through genuinely different policy environments: one actively cutting subsidies, one running a state-directed industrial buildout, and one operating under EU-wide climate targets.
It's worth pausing on why this particular combination of numbers is unusual rather than just impressive. In most policy-driven markets, when a major subsidy is removed, investment activity tends to dip in the following reporting period as developers reassess project economics and financing partners reprice risk. That's the textbook expectation, and it's the expectation a lot of early commentary around the US tax-credit rollback leaned on. What actually happened instead was a compressed rush of activity ahead of the deadline — the 170 GW safe-harbored before July 4 — followed by a full year of construction and investment that still broke records rather than merely avoiding collapse. That sequencing matters: it means the record 2026 numbers aren't simply measuring momentum from a subsidy that technically still existed for part of the year, they're measuring a market that reorganized itself around a hard deadline and kept moving at record pace on the other side of it.
None of this means the headwinds are imaginary or that the industry considers itself in the clear. Deloitte's 2026 Renewable Energy Industry Outlook offers the most sobering counterpoint in the research: it forecasts that annual solar, wind, and storage additions in the US could fall to a range of 30–66 GW per year between 2026 and 2030, down from a pre-rollback range of 54–85 GW per year. In other words, even with a record year in 2026, the trajectory Deloitte models is one of a smaller-than-it-would-have-been buildout over the back half of the decade — the credit rollback is expected to show up in the numbers eventually, just not yet, and not as dramatically as some initial commentary suggested it would. Deloitte also flags a separate warning sign: wind and solar M&A value fell 41% in the first nine months of 2025, even as capacity additions were climbing. That's a genuinely strange combination — physical buildout at record pace, deal-making activity falling sharply — and it's one of the more important nuances in this story rather than a footnote.
Why It's Trending Now
The single biggest explanatory factor showing up across the reporting is electricity demand growth driven by data centers and AI infrastructure. This isn't a minor contributing factor buried in the footnotes — multiple outlets covering the 2026 investment numbers point to data-center and AI electricity demand as a key reason investment kept flowing even as the subsidy environment worsened.
The logic is straightforward once you look at it from a utility or developer's perspective. A tax credit changes the economics of a project at the margin — it can make a marginal project viable or an already-attractive project more profitable. But it doesn't create demand for electricity. What creates demand for electricity, at a scale large enough to reshape a national investment picture, is a genuinely new category of very large, very power-hungry infrastructure coming online across the country: hyperscale data centers built to train and run AI models. When that demand shows up, someone has to supply the power, and wind and solar — being the fastest-to-build sources of new generation capacity in most markets — become the default answer regardless of what happens to a specific tax credit.
This also explains why the record year happened despite the rollback rather than in some parallel universe where the rollback didn't occur. Tax credits shape the margin of what gets built; demand shapes whether building anything is worthwhile at all. In 2026, demand growth was strong enough to keep the buildout at record levels even with a less favorable credit environment layered on top of it. That's a meaningfully different — and more durable — growth driver than a subsidy, because subsidies can be legislated away in a single bill, while data center demand tends to be locked in years in advance through the capital commitments hyperscalers have already made.
The "safe harboring" behavior developers displayed ahead of the July 4, 2026 tax-credit deadline is a second, related reason this is trending. Roughly 170 GW of capacity was reportedly safe-harbored — meaning developers took the specific legal and financial steps needed to lock in eligibility for the expiring credits before the deadline hit, even for projects that wouldn't be completed for years. That is an enormous number relative to the 45 GW that actually got built and connected to the grid in 2026, and it tells you two things at once: first, that developers took the credit rollback seriously enough to spend real money and effort protecting their pipeline against it; and second, that there's a multi-year backlog of pre-committed projects now working through construction, which helps explain why near-term capacity numbers can stay elevated even as the credit environment tightens.
There's a third reason this story is getting attention beyond the raw numbers: it's a rare case where a policy narrative and a demand narrative are running in full public view at the same time, and journalists and analysts covering the space have an unusually clean natural experiment to point to. Most years, it's hard to isolate how much of a given investment trend is driven by subsidy design versus underlying demand, because the two rarely move in sharply opposite directions within the same twelve-month window. 2026 removed that ambiguity. The credit rollback is a documented, dated policy event with a hard deadline attached to it, and the investment and capacity figures for the same period are unusually well tracked by multiple independent sources — E&E News and POLITICO on the investment side, MarketScale on generation-share figures, the IEA on global solar and wind output, and Deloitte on the forward-looking industry outlook. That convergence of clean, well-timed data is itself part of why this is trending as a story: it's a genuinely legible test of whether renewable investment has become demand-driven rather than subsidy-driven, and the early read is that it has, at least for now.
Who This Affects and What's at Stake
The businesses most directly affected by this shift split into a few overlapping groups, and the stakes differ meaningfully by group.
Renewable project developers and utilities are the most exposed. They're the ones who had to redo project financing models mid-pipeline when the credit rules changed, and they're the ones facing the Deloitte-modeled slowdown in the back half of the decade even as they navigate a record year right now. For this group, the 41% drop in wind/solar M&A value in the first nine months of 2025 is arguably a more important signal than the headline capacity numbers — it suggests that even as physical construction hits records, the deal market that finances future construction is getting more cautious, which is exactly the kind of leading indicator that tends to show up before capacity growth itself slows.
Large corporate electricity buyers — and especially the hyperscalers and enterprises building AI infrastructure — are a second group with real stakes here, because they're both a cause and a potential casualty of the dynamics described above. Their demand is one of the things propping up record investment, but if renewable buildout genuinely does slow toward the lower end of Deloitte's 30–66 GW/year range later in the decade while data center demand keeps climbing, the tightest resource in the system becomes electricity supply itself, not capital. Businesses that depend on predictable, large-scale power availability — whether for data centers, manufacturing, or any other power-intensive operation — have a direct interest in understanding whether the grid can actually keep pace with the demand curve they're helping to create.
A third group worth naming explicitly is any business whose operations, planning, or software depend on accurate forecasting of energy costs and availability. Grid operators, industrial energy buyers, and companies managing large facility portfolios increasingly rely on data-driven forecasting and automation to manage exposure to exactly this kind of volatility — swings in generation mix, regional buildout speed, and policy-driven cost shifts. That's a place where the operational and the strategic overlap: a company that can model its energy exposure with better tooling is simply better positioned than one guessing. Businesses building or buying that kind of forecasting and automation capability are effectively hedging against the uncertainty this whole trend represents; teams evaluating AI agents and automation for operational forecasting are, in a sense, applying the same underlying technology trend — AI-driven demand modeling — that's helping drive the renewable buildout in the first place.
Finally, workers and communities tied to renewable construction and manufacturing have a direct stake in whether the slowdown Deloitte projects for 2026–2030 actually materializes. A record year doesn't guarantee record years indefinitely, and a policy-driven credit rollback that takes a few years to fully show up in project pipelines is a real, if delayed, risk to employment in that sector.
There's also a quieter fifth group worth naming: financial institutions and dealmakers active in the renewable M&A market. The 41% drop in wind/solar M&A value reported for the first nine months of 2025 is a signal specifically about this group's behavior, and it's arguably more forward-looking than the capacity and investment headlines. Physical construction numbers reflect decisions made months or years earlier, often before the credit rollback was finalized; M&A activity reflects live decisions about how much a renewable project pipeline is worth today, under today's policy assumptions. A sharp pullback in that market, even while construction hits records, suggests the people whose job is specifically to price future risk are already discounting the sector more heavily than the headline capacity figures would imply — which is exactly the kind of divergence that tends to show up before, not after, a broader slowdown becomes visible in construction data itself.
The Global Picture
Renewable investment in 2026 isn't a single story — it's at least four or five different regional stories that happen to be converging on similar record-breaking outcomes through very different mechanisms.
United States. This is the most internally contradictory of all the regional pictures, and that's exactly what makes it interesting. The US is simultaneously experiencing a record year — $180 billion in projected 2026 clean energy investment, $74 billion of that already spent in H1, a record 45 GW of new capacity (25% above the 2024 peak), and wind and solar supplying 20% of H1 2026 generation, ahead of both coal and nuclear — and absorbing a real policy shock, with roughly 170 GW safe-harbored ahead of the July 4, 2026 tax-credit deadline as developers scrambled to preserve eligibility before it disappeared. Layered on top of that record year is Deloitte's forward-looking warning: annual solar/wind/storage additions for 2026–2030 could fall to a 30–66 GW/year range, down from a pre-rollback range of 54–85 GW/year, and wind/solar M&A value fell 41% in the first nine months of 2025. Read together, the US picture is "record year now, real risk of a slower back half of the decade" rather than a clean story in either direction.
United Kingdom. There's no distinct UK-specific renewable investment or capacity figure in the current research pass — the more detailed UK data available right now sits in adjacent topics covering carbon capture and storage (CCUS) and small modular reactors/battery storage, rather than in headline solar-and-wind investment numbers. That's worth stating plainly rather than guessing at UK figures that aren't part of the documented record here.
UAE / Dubai. The Gulf picture is one of aggressive, state-backed capacity expansion. UAE installed renewable capacity surpassed 7.7 GW as of April 2026, and the country has committed up to AED 200 billion to renewables by 2030 under its National Energy Strategy 2050. The flagship project is the Mohammed bin Rashid Al Maktoum Solar Park, described in the underlying reporting as the world's largest single-site solar park, alongside the Al Dhafra Solar PV plant — a 2 GW facility generating roughly 4.7 TWh per year. The UAE is also building out storage to match its generation growth: a new $1.421 billion storage plant will add 1,500 MWh of capacity, reaching full operation in 2027. This is a smaller absolute market than the US, EU, or China, but it's notable for the sheer scale of state commitment relative to the size of the country.
Australia. As with the UK, there's no distinct Australia-specific renewable investment figure in this research pass. Australia's most prominent related project — the Sun Cable solar-export initiative — is tracked under a separate battery-storage research topic rather than under headline solar/wind investment figures, so it isn't reflected here with specific numbers.
Germany. Germany's Energiewende program targets roughly 80% renewable electricity generation by 2030, a target that predates the current AI-demand-driven investment surge and reflects a longer-running national energy transition strategy. What's notable in the current reporting is that the German government has reportedly lowered some of its transition ambitions and cost targets since taking office, partly in response to revised electricity-demand estimates — a sign that even a country with one of the world's most established renewable-transition programs is recalibrating its plans as the underlying demand picture shifts, in this case seemingly in a more cautious direction rather than the accelerating direction seen in the US, China, and the EU.
Europe / France. At the EU level, 2025 was a record year: roughly 85 GW of new renewable capacity added, about 10% above 2024, with solar PV contributing approximately 70 GW of that total. There's no France-specific figure in this research pass that's distinct from the EU-wide total, so France's contribution is captured within that broader European number rather than reported separately.
China. China's 2025 renewable buildout is the largest in the world by a wide margin: nearly 500 GW of new capacity added in a single year, representing more than 60% of all global renewable capacity growth in that period. No other region in this research comes close to that absolute scale, and it's the clearest illustration of how much of the global renewable growth story is currently being written by one country's industrial policy and manufacturing capacity.
Taken together, the regional picture shows record or near-record growth in the US, EU, and China through three very different mechanisms — resilient private investment absorbing a subsidy cut in the US, state-directed climate policy in the EU, and state-directed industrial-scale manufacturing and deployment in China — alongside a UAE that's using sovereign wealth to build outsized flagship projects, a Germany that's quietly recalibrating its longstanding targets, and a UK and Australia where the current research simply doesn't surface distinct headline numbers.
What's striking when you line these regions up side by side is how little the mechanism seems to matter to the outcome. The US, EU, and China are pursuing renewable buildout through what are, on paper, almost opposite policy philosophies — a market that just had a major subsidy pulled out from under it, a bloc coordinating climate targets across dozens of member states, and a single-party industrial policy apparatus building at a scale no other economy can currently match — and all three still landed on record or near-record capacity-addition years within roughly the same window. That's a reasonable basis for treating the underlying demand growth, rather than any one region's specific policy toolkit, as the common thread tying these otherwise very different national stories together. It's also a reminder that regions without a clear renewable-policy narrative right now — the UK and Australia, in this particular research pass — aren't necessarily behind; it may simply mean their most notable current activity is being tracked and reported under adjacent categories, like the UK's CCUS and battery-storage coverage or Australia's Sun Cable project, rather than under headline solar-and-wind investment figures specifically.
What This Means Going Forward
The most important thing to take away from 2026's numbers is that they describe a peak, not necessarily a plateau. Every piece of forward-looking analysis in the underlying research — Deloitte's outlook chief among them — treats 2026 as the high point of a cycle that's likely to moderate rather than as the new steady state. A 30–66 GW/year range for 2026–2030, compared to a pre-rollback 54–85 GW/year range, still represents meaningful continued buildout; it's a deceleration, not a collapse, but it's a deceleration that businesses planning multi-year energy strategies should factor in rather than assume away.
For companies whose operations are sensitive to electricity availability and pricing — data center operators, manufacturers, and any business scaling AI infrastructure that depends on power-hungry compute — the practical implication is to treat electricity supply as a planning variable with real uncertainty attached to it, not a background assumption. The same demand growth that's currently helping drive record renewable investment is also the demand growth that could outpace supply if the Deloitte-style slowdown materializes on schedule. Businesses building long-term infrastructure roadmaps, particularly those investing in custom software and systems to manage energy procurement, forecasting, or facility operations, have a genuine reason to build flexibility into those systems now rather than assuming the current record-investment environment continues indefinitely.
For businesses in industries adjacent to energy — construction, industrial equipment, logistics serving renewable project sites, or professional services supporting project developers — the near-term signal is still positive: a record year means real, ongoing demand for the services and supply chains that support renewable construction, even if the multi-year outlook carries more uncertainty. Companies serving these markets can review how comparable projects have approached similar transitions in the case studies of businesses that have navigated shifting regulatory and demand environments, and think concretely about how exposed their own pipeline is to the credit-driven and demand-driven swings described above.
It's also worth being honest about what the 2026 numbers don't settle. They don't tell us whether Deloitte's more cautious 30–66 GW/year forecast for 2026–2030 will prove accurate, or whether demand growth keeps outrunning even that lowered range the way it outran the credit rollback this year. They don't tell us whether the 41% drop in M&A value is an early warning sign that construction activity will eventually follow downward, or a temporary repricing that resolves once the market fully adjusts to the new policy baseline. And they don't tell us how Germany's more cautious recalibration of its Energiewende targets, or the gaps in UK and Australia reporting, will resolve as those markets generate more data of their own. Treating 2026 as a genuinely record year — which the numbers clearly support — is different from treating it as proof that every open question about the sector's trajectory has been answered, and the more useful posture for any business planning around this trend is to track both the record-setting headlines and the more cautious forward-looking forecasts side by side, rather than picking whichever one is more convenient for a given decision.
The resilience shown in 2026 — investment climbing through a real subsidy cut — is also a useful data point for anyone assessing political risk in the renewable sector generally. It suggests that the sector's growth is no longer purely, or even primarily, subsidy-dependent; demand fundamentals, especially from data centers and AI infrastructure, are now large enough to be a genuine independent driver. That doesn't mean policy no longer matters — the safe-harboring rush and the Deloitte slowdown forecast both show policy still moves real capital and real decisions — but it does mean the "one bad policy year kills renewable investment" narrative doesn't match what actually happened in 2026. Businesses across industries that touch energy, infrastructure, or large-scale facility operations should read this year's numbers as evidence that the underlying demand story, not just the subsidy story, is now the dominant force shaping the sector's trajectory — and plan accordingly for both continued growth and the real possibility of a more moderate pace ahead.
Questions People Are Actually Asking About the Renewable Investment Boom
Will renewable energy investment keep growing after US tax credits expire?
The 2026 data suggests growth continued through the credit expiration itself — the US hit a record $180 billion investment projection and 45 GW of new capacity in the same year the credits were phased out, which is direct evidence that renewable investment isn't purely credit-dependent anymore. That said, "kept growing in 2026" and "will keep growing indefinitely" aren't the same claim. Deloitte's own forecast models a deceleration to a 30–66 GW/year range for 2026–2030, down from a pre-rollback 54–85 GW/year range, meaning the credible forward-looking view is continued growth at a more moderate pace, not an assumption that record-breaking years repeat every year. The 170 GW safe-harbored ahead of the July 2026 deadline also means a multi-year pipeline of committed projects is now working through construction regardless of the credit change, which should support near-term numbers even as the underlying growth rate normalizes.
Why is data center electricity demand boosting renewable energy investment?
Data centers built to train and run AI models are large, constant, and rapidly growing consumers of electricity, and that demand has to be met by new generation capacity somewhere. Reporting on the 2026 investment surge specifically cites data-center and AI electricity demand as a key factor pulling investment forward even as subsidies shrank — in effect, demand growth is now doing some of the work that tax credits used to do in making new renewable projects economically necessary rather than just economically attractive. Wind and solar tend to be the fastest sources of new generation capacity to bring online in most markets, which makes them the default answer when large new demand shows up quickly, as hyperscale data center buildouts tend to do. This is also a two-way relationship worth watching: the more AI infrastructure gets built, the more this demand-driven investment case strengthens, but it also raises the stakes on whether renewable supply growth can keep pace with AI-driven demand growth over the rest of the decade.
What is "safe harboring" and why did developers rush to do it before July 2026?
Safe harboring refers to the legal and financial steps a project developer takes to lock in eligibility for a tax credit before that credit's rules change or expire, even if the physical project itself won't be completed for years. Ahead of the July 4, 2026 deadline tied to the US tax-credit rollback, developers reportedly safe-harbored roughly 170 GW of capacity — a figure nearly four times the 45 GW that was actually built and connected in 2026 itself. That gap matters: it means a large pipeline of projects has preserved its access to expiring incentives and will likely proceed with construction over the coming years specifically because that eligibility was protected in time, which helps explain why near-term capacity numbers can stay elevated even as the broader credit environment becomes less favorable for any new projects that missed the deadline.
How much did the US invest in clean energy in 2026?
US clean energy investment for 2026 is projected at approximately $180 billion for the full year, with $74 billion of that already deployed as capital expenditure in the first half of the year alone. That pace, combined with the record 45 GW of new wind and solar capacity added, represents roughly 25% more capacity than the prior peak year, 2024. This happened in the same year the federal tax-credit rollback took effect, which is part of why the figure is being reported as notable — it's a record investment year layered directly on top of a real policy headwind rather than a record year achieved under favorable subsidy conditions.
How does China's renewable capacity growth compare to the rest of the world?
China added nearly 500 GW of new renewable capacity in 2025, a figure that by itself accounted for more than 60% of all renewable capacity growth added globally that year. For comparison, the US added a record 45 GW in 2026 and the EU added a record ~85 GW in 2025 — meaning China's single-year addition was roughly ten times the record US figure and nearly six times the record EU figure. This scale gap reflects China's position as both the world's largest manufacturer of solar panels and wind turbine components and a market where renewable deployment is directed at an industrial-policy scale rather than shaped primarily by tax-credit economics or corporate investment decisions the way it is in the US and much of Europe.
What is the UAE's target for renewable energy investment by 2030?
The UAE has committed up to AED 200 billion to renewable energy by 2030 under its National Energy Strategy 2050, and as of April 2026 the country's installed renewable capacity had already surpassed 7.7 GW. That commitment underwrites flagship projects including the Mohammed bin Rashid Al Maktoum Solar Park and the 2 GW Al Dhafra Solar PV plant, plus a $1.421 billion battery storage plant adding 1,500 MWh of capacity that's set to reach full operation in 2027. For businesses evaluating the Gulf region as an energy or infrastructure market, this level of sovereign, state-directed commitment is a meaningfully different investment dynamic than the private-capital-driven model dominant in the US, and it's worth understanding through the lens of the industries most exposed to Gulf infrastructure spending.
Is Germany on track to hit 80% renewable electricity by 2030?
Germany's Energiewende program targets approximately 80% renewable electricity generation by 2030, but the current reporting indicates the German government has lowered some of its transition ambitions and cost targets since taking office, partly in response to revised electricity-demand estimates. That's a meaningfully different signal than the US, EU, and China are sending in 2026 — rather than accelerating toward records, Germany's most recent policy signal is one of recalibration. Whether that means the 80% target itself is being pushed back, or simply that the cost and pathway assumptions underneath it are being revised, isn't fully specified in current public reporting, but the direction of travel — toward more caution rather than more ambition — stands out against the record-setting numbers reported elsewhere.
What is the largest solar park in the world and where is it located?
The Mohammed bin Rashid Al Maktoum Solar Park in the UAE is described in current reporting as the world's largest single-site solar park. It sits alongside the separate Al Dhafra Solar PV plant, a 2 GW facility generating an estimated 4.7 TWh of electricity per year, as one of the two flagship projects underpinning the UAE's broader renewable buildout, which is backed by a national commitment of up to AED 200 billion by 2030 and had already pushed the country's total installed renewable capacity past 7.7 GW as of April 2026.
Are US renewable energy tax credits coming back after being cut?
Current public reporting documents the tax-credit phase-out and the market's response to it — including the rush to safe-harbor roughly 170 GW of capacity ahead of the July 2026 deadline and Deloitte's forecast of a slower 2026–2030 buildout pace as a result — but it does not document any confirmed plan to reinstate the credits. Given how policy-driven this area is, the honest answer is that this remains genuinely uncertain and depends on future legislative and political decisions rather than anything currently locked in. What is documented is that the market has largely already priced in the rollback as durable: developers rushed to protect existing project eligibility rather than waiting for a reversal, and forward-looking industry forecasts like Deloitte's model a lower-credit environment as the base case through 2030.
What impact does the rollback of US IRA incentives have on global clean energy markets?
Within the US, the rollback is associated with a scramble to safe-harbor roughly 170 GW of capacity, a projected slowdown in annual additions to a 30–66 GW/year range for 2026–2030 (down from 54–85 GW/year), and a 41% drop in wind/solar M&A value in the first nine months of 2025 — even as the US still hit a record 45 GW of new capacity in 2026 itself. Globally, the rollback doesn't appear to have dampened records elsewhere: China added nearly 500 GW in 2025 and the EU added a record ~85 GW the same year, both independent of US federal tax policy. That suggests the US policy shift is primarily reshaping the pace and financing structure of the US market specifically, rather than acting as a drag on the broader global renewable buildout, which is being driven by different policy and demand dynamics in China and the EU.
How is the EU's 2025 renewable buildout comparable to the US and China?
The EU added a record ~85 GW of renewable capacity in 2025, roughly 10% above its 2024 total, with solar PV contributing about 70 GW of that figure. That's nearly double the US's record 45 GW added in 2026, though the US figure covers a single year of capacity additions under a much less favorable subsidy environment than the EU operates under. China's nearly 500 GW added in 2025 dwarfs both figures, representing well over five times the EU's record total and more than ten times the US record. Read together, these three figures show renewable buildout accelerating simultaneously across the world's three largest economic blocs in 2025–2026, but at dramatically different absolute scales driven by different underlying policy models.
What is driving the UAE's aggressive solar expansion in the Gulf?
The UAE's expansion is driven by a top-down national strategy — the National Energy Strategy 2050 — backed by a committed investment figure of up to AED 200 billion by 2030, rather than by the kind of tax-credit or subsidy mechanics shaping the US market. That state-directed capital has funded flagship, large-scale projects like the Mohammed bin Rashid Al Maktoum Solar Park and the 2 GW Al Dhafra Solar PV plant, and it's now extending into storage infrastructure, with a $1.421 billion, 1,500 MWh storage plant set to reach full capacity in 2027. The UAE's installed renewable capacity had already passed 7.7 GW by April 2026, reflecting a deliberate, sovereign-wealth-funded diversification strategy for a country whose economy has historically been built around oil and gas exports.
Which US states are leading in new solar and wind capacity in 2026?
Current reporting on the 2026 US renewable investment surge is aggregated at the national level — the $180 billion investment projection, $74 billion in H1 capex, and the record 45 GW of new capacity are all reported as national totals rather than broken out by state. Historically, states with strong wind and solar resource availability, supportive permitting environments, and significant data-center or industrial electricity demand tend to lead national buildout figures, but this research pass doesn't include a state-by-state breakdown for 2026 specifically, so any state-level claim beyond that would go further than the documented record supports.
What is the difference between renewable capacity additions and actual generation output?
Capacity additions measure how much new generating equipment — solar panels, wind turbines — gets installed and connected to the grid in a given period, typically reported in gigawatts (GW). Generation output measures how much actual electricity that equipment produces over time, typically reported as a share of total electricity generated or in terawatt-hours. The 2026 US data illustrates the distinction well: the US added a record 45 GW of new capacity, and separately, wind and solar together supplied 20% of total US electricity generation in the first half of 2026 — a generation-share figure that reflects both new capacity coming online and the output of previously built capacity, and that's shaped by factors like weather, grid curtailment, and how much existing fossil and nuclear generation is running alongside renewables, not just how much new capacity was installed.
Are corporate power purchase agreements (PPAs) driving renewable buildout?
Corporate PPAs — long-term contracts where a business commits to buying a fixed amount of renewable electricity directly from a developer — are a well-established financing mechanism in renewable energy generally, and the broader demand story described in current 2026 reporting, particularly data centers and AI infrastructure operators needing large, reliable electricity supply, is exactly the kind of demand that tends to get structured through PPAs in practice. Current research doesn't include a specific 2026 PPA volume figure, so the precise scale of PPA-driven demand versus other financing mechanisms isn't documented here, but the underlying dynamic — large corporate electricity buyers locking in renewable supply to meet their own demand and sustainability commitments — is consistent with what's driving investment. Businesses exploring this path often start by reviewing how peers in comparable case studies have structured similar long-term commitments.
What role does battery storage play in enabling more renewable capacity?
Battery storage helps solve one of renewable energy's core limitations — that solar and wind generation is variable and doesn't always align with when electricity is needed — by storing excess generation for use later. The UAE's buildout illustrates this directly: alongside its solar capacity expansion, it's building a $1.421 billion storage plant that will add 1,500 MWh of capacity, reaching full operation in 2027, specifically to support the reliability of its growing renewable generation base. As renewable capacity additions keep setting records across the US, EU, and China, storage buildout tends to become an increasingly necessary complement rather than an optional add-on, since more variable generation on the grid generally increases the value of being able to time-shift when that power gets used.
Is the world on track to triple renewable capacity by 2030 (the COP28 pledge)?
The 2025–2026 numbers in current reporting — China's nearly 500 GW added in 2025, the EU's record ~85 GW in 2025, and the US's record 45 GW in 2026 — show substantial, accelerating global buildout, but this research pass doesn't include a specific IEA assessment of global progress against the COP28 tripling pledge itself. What can be said accurately is that multiple major markets are setting individual capacity-addition records simultaneously, which is a positive signal for global trajectory, while Deloitte's US-specific forecast of a slowdown to 30–66 GW/year for 2026–2030 is a reminder that record years don't automatically extrapolate into sustained records everywhere. A full assessment of pledge progress would require global cumulative capacity figures against the COP28 baseline, which isn't part of the documented data here.
What is the payback period for a utility-scale solar investment in 2026?
Current research doesn't include a specific payback-period figure for utility-scale solar in 2026; Deloitte's 2026 Renewable Energy Industry Outlook is cited as a general source on renewable-economics trends, but a precise payback-period number isn't part of the documented findings here. In general terms, payback periods for utility-scale solar depend heavily on financing costs, local electricity prices, available incentives, and project-specific factors like land and interconnection costs — all of which the 2026 tax-credit rollback would tend to lengthen for US projects that didn't secure safe-harbor status, since the removal of a credit generally increases the net capital a developer has to recover through electricity sales alone.
Are renewable energy stocks a good investment given record capacity growth?
Scult doesn't provide personalized investment advice, and the honest answer from the available data is genuinely mixed rather than simply bullish. On one hand, capacity additions are at record levels across the US, EU, and China. On the other, Deloitte reports that wind/solar M&A value fell 41% in the first nine months of 2025 even as physical buildout accelerated — a divergence between deal-making sentiment and construction activity that's unusual and worth understanding before drawing conclusions either way. A Crux executive was quoted describing the renewable market as "proving resilient" through the policy headwinds, which reflects confidence in the sector's underlying demand fundamentals, but resilience in aggregate investment figures isn't the same claim as a specific recommendation about any individual stock or fund, and anyone considering that kind of decision should consult a licensed financial advisor.
How does grid curtailment affect renewable energy economics?
Curtailment happens when grid operators reduce or halt output from renewable generators — even though the wind is blowing or the sun is shining — because the grid can't absorb, transmit, or store the electricity being produced at that moment. It directly affects renewable project economics because curtailed generation is electricity that could have been sold but wasn't, reducing a project's actual revenue relative to its theoretical output. This is part of why the distinction between capacity additions and actual generation share matters: the US's record 45 GW of new 2026 capacity and its 20% generation share in H1 2026 both depend, in part, on how much of that new capacity's output actually reaches the grid rather than being curtailed, and why storage buildout — like the UAE's new 1,500 MWh plant — is increasingly paired with generation buildout to reduce this kind of lost value.
Why did wind and solar M&A value fall even as capacity additions hit records?
This is one of the more genuinely puzzling findings in Deloitte's 2026 outlook: wind/solar M&A value fell 41% in the first nine months of 2025 while physical capacity additions were simultaneously hitting records in the US, EU, and China. The plainest reading is that these are two different markets responding to two different pressures — construction activity reflects projects that were already financed and moving through development pipelines (including the large volume safe-harbored ahead of the US tax-credit deadline), while M&A activity reflects investor and acquirer sentiment about future project value under a changed, less subsidy-friendly policy environment. In other words, the physical buildout may be running on momentum from decisions made before the rollback, while the deal market is already pricing in a more cautious view of what comes next — which lines up with Deloitte's own forecast of a slower 2026–2030 pace.
What is Germany's BEE renewable energy federation warning about the energy transition?
Germany's BEE renewable energy federation has reportedly warned that renewable energy supply may not be growing fast enough to keep pace with AI-driven electricity demand growth. That warning sits in contrast to the US, EU, and China narrative of record-breaking renewable buildout in the same period, and it lines up with the broader German signal of the government lowering some Energiewende transition ambitions and cost targets in response to revised demand estimates. Together, these signals suggest Germany's policy conversation in 2026 is centered more on whether renewable supply growth can keep up with a demand curve reshaped by AI infrastructure than on setting new capacity records, which is a meaningfully different posture than the investment-resilience story playing out in the US.
How much of Australia's electricity comes from renewables in 2026?
This research pass doesn't include a distinct Australia-specific figure for renewable electricity share in 2026 — Australia's most prominent related project in the underlying research, the Sun Cable solar-export initiative, is tracked under a separate battery-storage topic rather than under headline renewable-generation-share reporting. That's an honest gap in the current research rather than a finding, and it's worth flagging as an open question for anyone specifically tracking the Australian market rather than filling it in with an unverified number.
Are utility companies profitable when investing heavily in renewables amid tax-credit uncertainty?
Current reporting doesn't include specific utility-company profitability figures tied to renewable investment under the 2026 tax-credit changes. What the reporting does include is a broader characterization of the market's response: a Crux executive described the renewable investment market as "proving resilient" despite the credit rollback, and the record $180 billion US investment figure and 45 GW of new capacity suggest capital continued flowing into the sector at scale through 2026. Resilience in aggregate investment activity is a different claim than confirmed profitability at the individual utility or developer level, though, and the 41%-drop in M&A value reported for late 2025 suggests at least some investors are pricing in more caution about future returns than the headline capacity numbers alone would suggest.
What happens to renewable energy jobs if federal support is cut further?
Current research doesn't include specific 2026 renewable-sector employment figures, so a precise jobs impact isn't part of the documented findings here. What is documented is Deloitte's forecast that annual US solar/wind/storage additions could fall to a 30–66 GW/year range for 2026–2030, down from a pre-rollback 54–85 GW/year range, alongside a 41% drop in wind/solar M&A value in the first nine months of 2025. Construction and manufacturing employment in the renewable sector tends to track the pace of physical buildout fairly closely, so a slowdown of the scale Deloitte models — if it materializes as projected — would generally be expected to translate into slower job growth in the sector over the back half of the decade relative to the pace seen through the record 2026 year, though the exact magnitude isn't quantified in current reporting.
How resilient is the renewable energy market to political policy swings?
The 2026 evidence is genuinely notable on this point: the US hit record clean energy investment ($180 billion projected) and record capacity additions (45 GW, up 25% from the 2024 peak) in the same year its federal tax-credit structure was rolled back. A Crux executive described the market as "proving resilient" in response to exactly this dynamic. That said, resilience isn't the same as immunity — the rush to safe-harbor 170 GW of capacity ahead of the deadline, the 41% drop in M&A value, and Deloitte's forecast of a slower 2026–2030 buildout all show that policy changes are still moving real capital and real decisions, just with more delay and more absorption capacity than a simpler "policy cut kills investment" narrative would predict. The most accurate summary is that demand fundamentals — especially from data centers and AI infrastructure — have made the sector meaningfully more resilient to policy swings than it was in earlier renewable-investment cycles, without making it fully policy-proof.